
Data Visualization
Widgetboards and data visualization
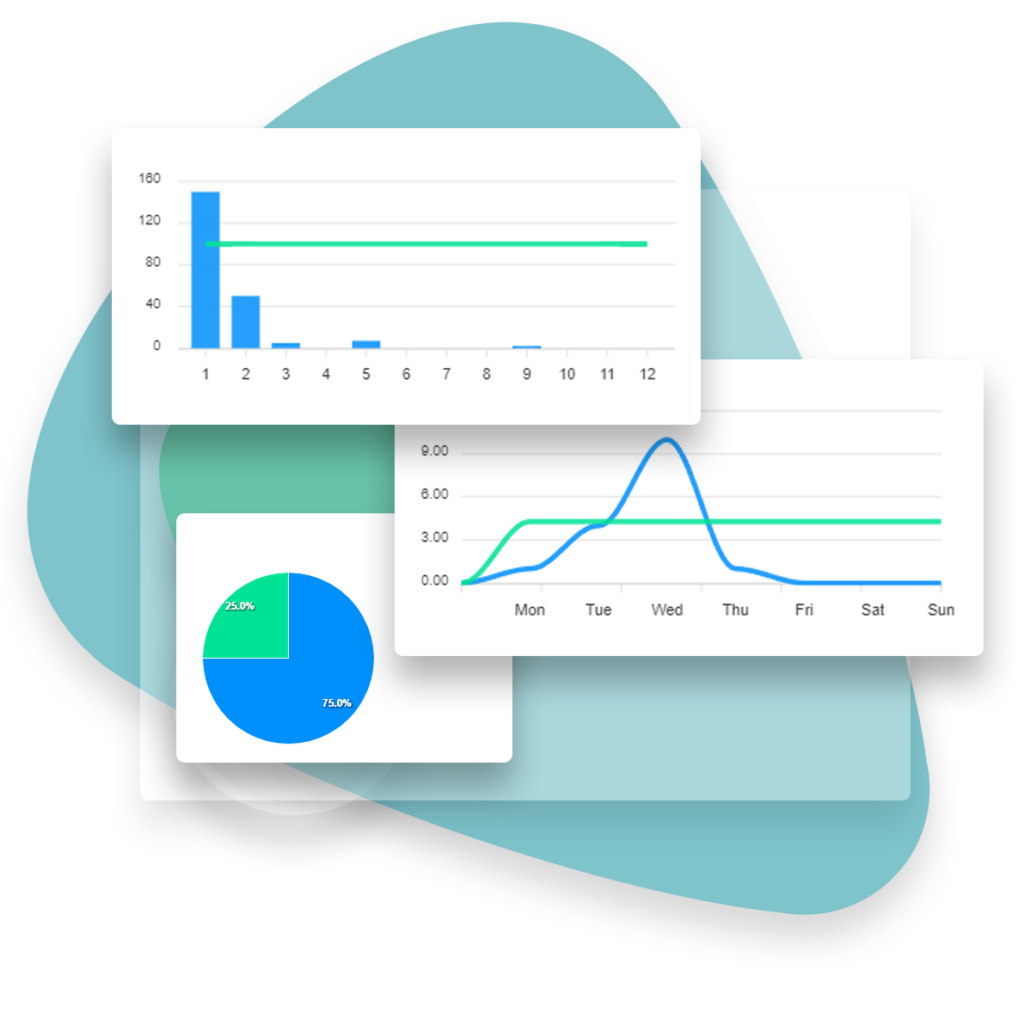
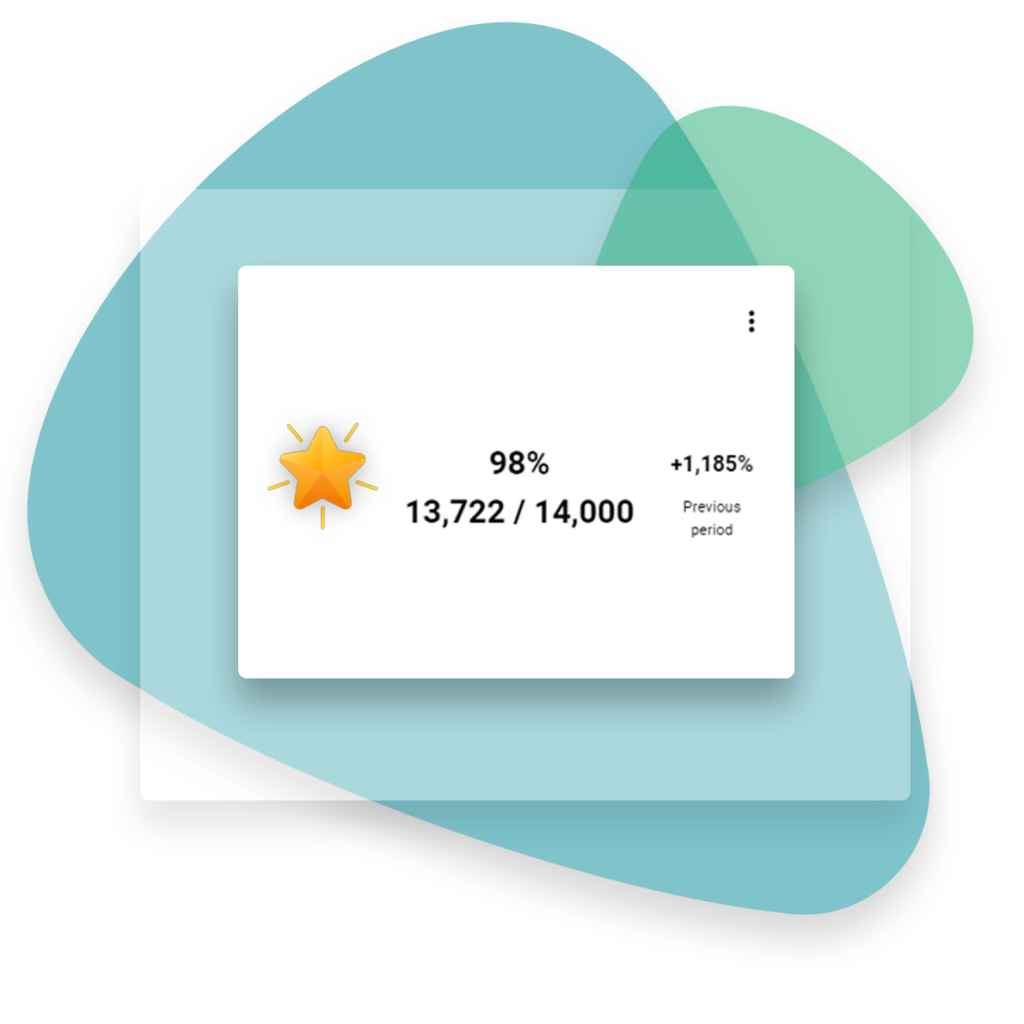
Widget boards enable tracking key performance metrics. It is easy to compare data and identify trends.
Display the dashboard on a TV screen for real-time performance tracking.

Data Visualization
Widget boards enable tracking key performance metrics. It is easy to compare data and identify trends.
Display the dashboard on a TV screen for real-time performance tracking.
Data Visualization
Data Visualization
Data Visualization
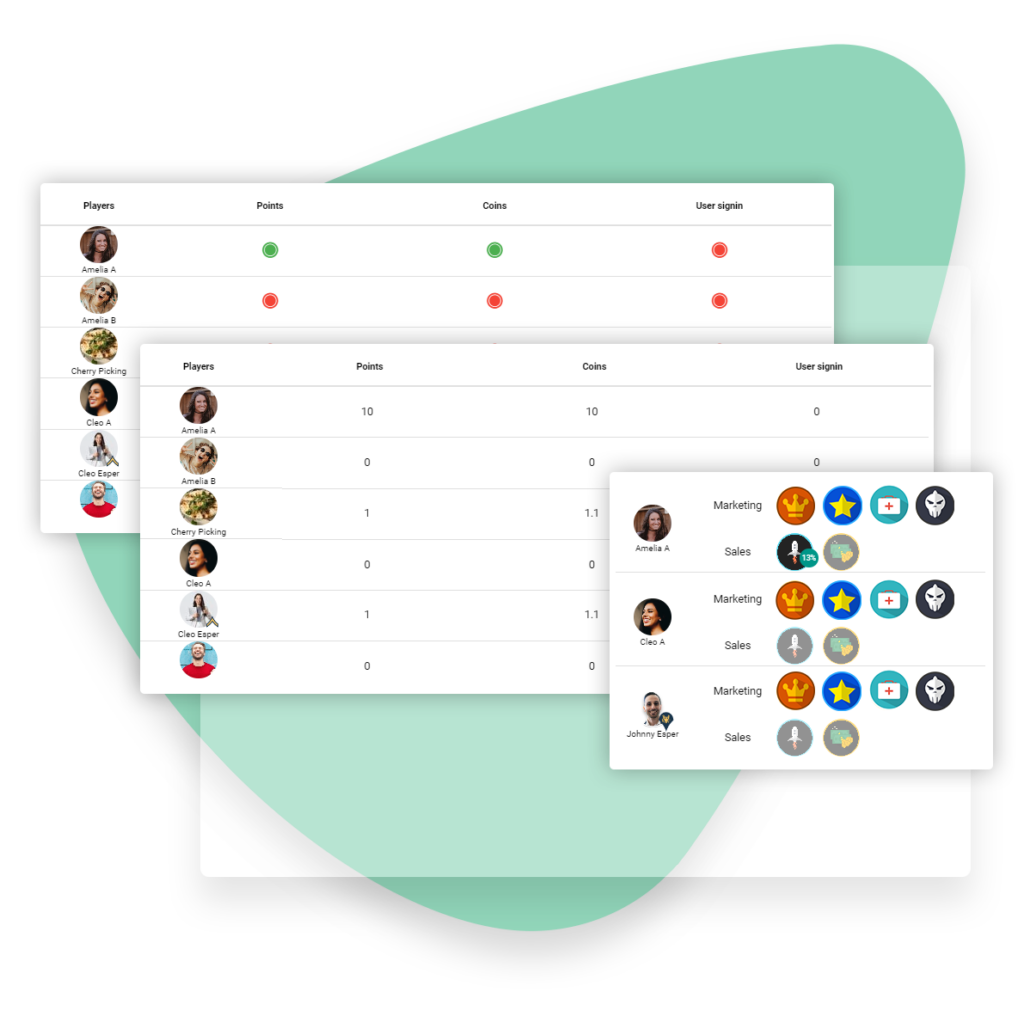
List view widgets offer users a powerful way to display multiple data series in a single table, providing a concise and user-friendly grid overview. In addition, it can show showcase badge progression.
Data visualization
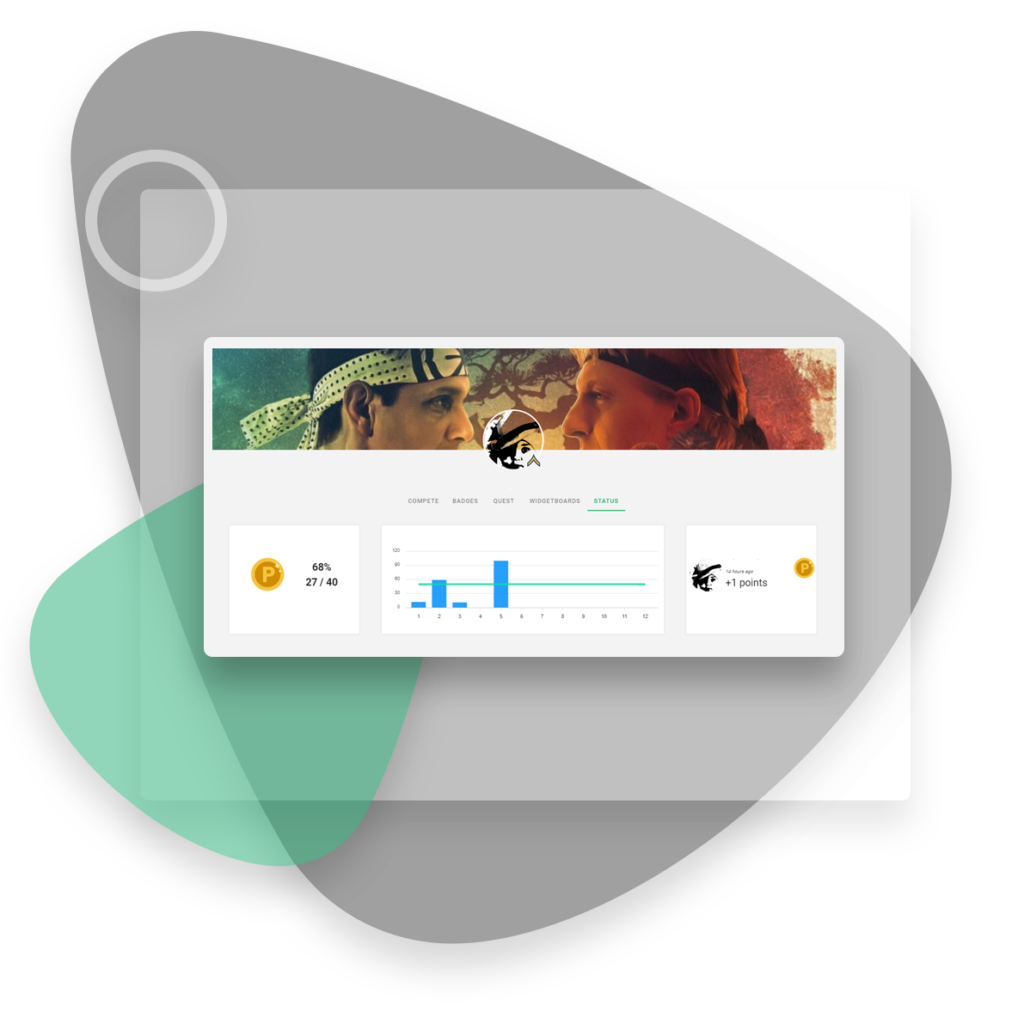
Create and group widgets into a dashboard and push it to the player profile page to show stats and target progression.
| Cookie | Duration | Description |
|---|---|---|
| yt-player-headers-readable | never | The yt-player-headers-readable cookie is used by YouTube to store user preferences related to video playback and interface, enhancing the user's viewing experience. |
| yt-remote-cast-available | session | The yt-remote-cast-available cookie is used to store the user's preferences regarding whether casting is available on their YouTube video player. |
| yt-remote-cast-installed | session | The yt-remote-cast-installed cookie is used to store the user's video player preferences using embedded YouTube video. |
| yt-remote-connected-devices | never | YouTube sets this cookie to store the user's video preferences using embedded YouTube videos. |
| yt-remote-device-id | never | YouTube sets this cookie to store the user's video preferences using embedded YouTube videos. |
| yt-remote-fast-check-period | session | The yt-remote-fast-check-period cookie is used by YouTube to store the user's video player preferences for embedded YouTube videos. |
| yt-remote-session-app | session | The yt-remote-session-app cookie is used by YouTube to store user preferences and information about the interface of the embedded YouTube video player. |
| yt-remote-session-name | session | The yt-remote-session-name cookie is used by YouTube to store the user's video player preferences using embedded YouTube video. |
| ytidb::LAST_RESULT_ENTRY_KEY | never | The cookie ytidb::LAST_RESULT_ENTRY_KEY is used by YouTube to store the last search result entry that was clicked by the user. This information is used to improve the user experience by providing more relevant search results in the future. |
| Cookie | Duration | Description |
|---|---|---|
| _fbp | 3 months | Facebook sets this cookie to display advertisements when either on Facebook or on a digital platform powered by Facebook advertising after visiting the website. |
| _ga | 1 year 1 month 4 days | Google Analytics sets this cookie to calculate visitor, session and campaign data and track site usage for the site's analytics report. The cookie stores information anonymously and assigns a randomly generated number to recognise unique visitors. |
| _ga_* | 1 year 1 month 4 days | Google Analytics sets this cookie to store and count page views. |
| _gcl_au | 3 months | Google Tag Manager sets the cookie to experiment advertisement efficiency of websites using their services. |
| Cookie | Duration | Description |
|---|---|---|
| fr | 3 months | Facebook sets this cookie to show relevant advertisements by tracking user behaviour across the web, on sites with Facebook pixel or Facebook social plugin. |
| PREF | 8 months | PREF cookie is set by Youtube to store user preferences like language, format of search results and other customizations for YouTube Videos embedded in different sites. |
| test_cookie | 15 minutes | doubleclick.net sets this cookie to determine if the user's browser supports cookies. |
| VISITOR_INFO1_LIVE | 6 months | YouTube sets this cookie to measure bandwidth, determining whether the user gets the new or old player interface. |
| VISITOR_PRIVACY_METADATA | 6 months | YouTube sets this cookie to store the user's cookie consent state for the current domain. |
| YSC | session | Youtube sets this cookie to track the views of embedded videos on Youtube pages. |
| yt.innertube::nextId | never | YouTube sets this cookie to register a unique ID to store data on what videos from YouTube the user has seen. |
| yt.innertube::requests | never | YouTube sets this cookie to register a unique ID to store data on what videos from YouTube the user has seen. |